The Power of Data Visualization: Why Every Business Needs a Dashboard
Analytics•March 10, 2024•New York
Share Article
Table of Contents
Share Article
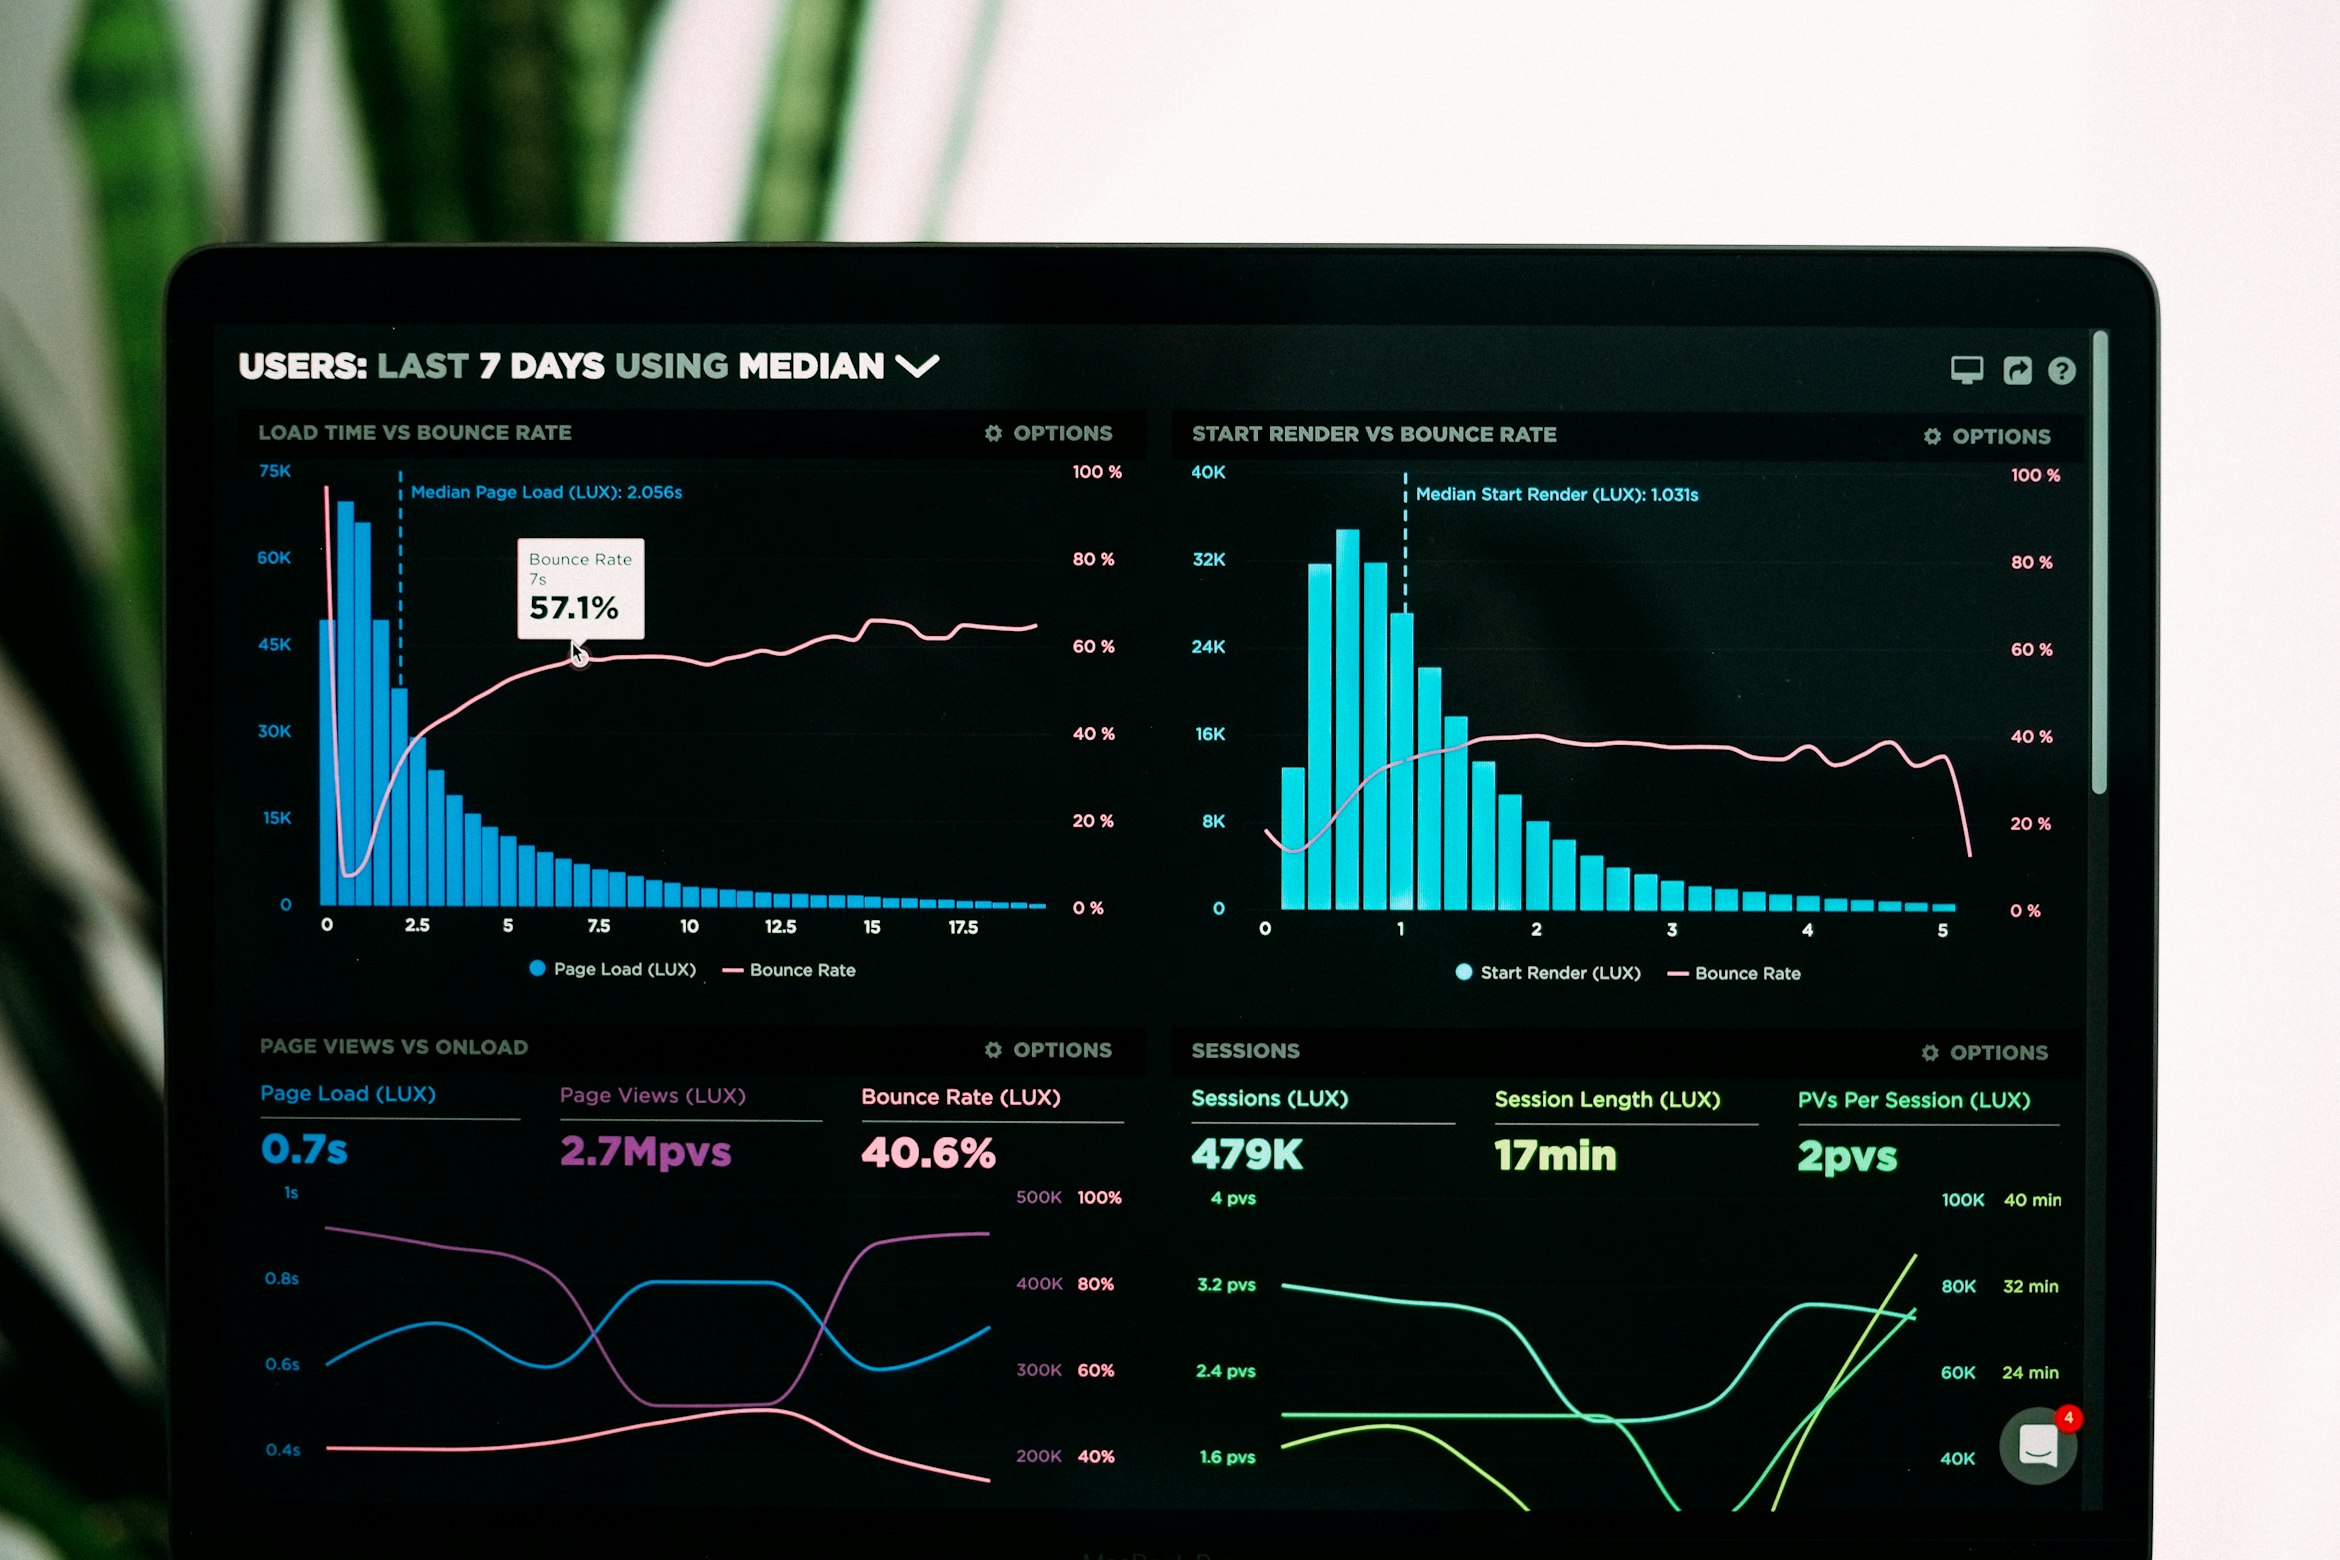
Data visualization is more than just pretty charts and graphs; it's a powerful way to communicate complex information quickly and effectively.
Why Our Brains Love Visuals
The human brain processes visual information 60,000 times faster than text. Visuals help us spot patterns, trends, and outliers that might go unnoticed in a spreadsheet full of numbers.
Recommended Articles

Business
How Smart Dashboards Drive Business Growth and Efficiency
Discover how the right tools can transform complex workflows into simple, actionable insights — helping your business scale faster.

Startup
Scaling Your Startup: Essential Digital Tools for Growth
From CRM to automation, discover the must-have tools every growing startup needs to scale efficiently.